- Research
- Open access
- Published:
Association of area- and volumetric-mammographic density and breast cancer risk in women of Asian descent: a case control study
Breast Cancer Research volume 26, Article number: 79 (2024)
Abstract
Background
Mammographic density (MD) has been shown to be a strong and independent risk factor for breast cancer in women of European and Asian descent. However, the majority of Asian studies to date have used BI-RADS as the scoring method and none have evaluated area and volumetric densities in the same cohort of women. This study aims to compare the association of MD measured by two automated methods with the risk of breast cancer in Asian women, and to investigate if the association is different for premenopausal and postmenopausal women.
Methods
In this case–control study of 531 cases and 2297 controls, we evaluated the association of area-based MD measures and volumetric-based MD measures with breast cancer risk in Asian women using conditional logistic regression analysis, adjusting for relevant confounders. The corresponding association by menopausal status were assessed using unconditional logistic regression.
Results
We found that both area and volume-based MD measures were associated with breast cancer risk. Strongest associations were observed for percent densities (OR (95% CI) was 2.06 (1.42–2.99) for percent dense area and 2.21 (1.44–3.39) for percent dense volume, comparing women in highest density quartile with those in the lowest quartile). The corresponding associations were significant in postmenopausal but not premenopausal women (premenopausal versus postmenopausal were 1.59 (0.95–2.67) and 1.89 (1.22–2.96) for percent dense area and 1.24 (0.70–2.22) and 1.96 (1.19–3.27) for percent dense volume). However, the odds ratios were not statistically different by menopausal status [p difference = 0.782 for percent dense area and 0.486 for percent dense volume].
Conclusions
This study confirms the associations of mammographic density measured by both area and volumetric methods and breast cancer risk in Asian women. Stronger associations were observed for percent dense area and percent dense volume, and strongest effects were seen in postmenopausal individuals.
Background
Mammographic density (MD) reflects the composition of fibro-glandular tissue of the breast, as visualised on a mammogram. MD is an independent predictor of breast cancer risk, although the strength of its association varies across studies, due in part to the different methods of MD assessment and different partitioning thresholds used to define high and low MD [1,2,3]. Efforts to make measuring MD less reader-dependent and more reproducible have resulted in the development of a number of fully-automated methods for measuring MD [4,5,6], including both volumetric and area-based assessments methods.
In women of European ancestry Volumetric assessments of density have been shown to be a stronger predictor of risk compared to area-based density [7, 8]. Volumetric methods are less influenced by compression force and are more sensitive to breast thickness, and may more accurately estimate the amount of fibroglandular tissue for women with larger breasts [9,10,11]. However Asian women have smaller and denser breasts compared to women of European ancestry, and the performance of area and volume-based densities have hitherto not been compared in the same study.
In this study, we aim to determine and compare the effects of two automated MD measures, namely STRATUS measurements of area densities, and Volpara measurements of volumetric densities, on breast cancer risk in the Asian population, and to explore the potential variation by menopausal status.
Methods
Study participants, data collection and eligibility criteria
Cases comprised of patients who were recruited sequentially into the Malaysian Breast Cancer Genetics (MyBrCa) study from Subang Jaya Medical Centre (SJMC), between 2012 and 2020, and University Malaya Medical Centre (UMMC), between 2003 and 2020. Controls were women between 40 and 74 years old with no prior history of breast cancer that were recruited into the Malaysian Mammography Study (MyMammo) from the same participating hospitals as cases. The study details have been previously published [12]. All participants answered a detailed questionnaire which included information on lifestyle and reproductive risk factors, socio-demographic factors, and family history and provided blood sample for genetic testing.
Bilateral full-field digital mammograms (FFDMs) for cases were retrieved from the medical image storage servers retrospectively starting in June 2018 and for controls were collected at recruitment. The bilateral cranio-caudal (CC) and medio-lateral oblique (MLO) views for both raw and processed images, where possible, were retrieved. Cases were excluded from the research study if: (a) digital mammograms were conducted more than 12 months prior to cancer diagnosis, (b) only mammograms ipsilateral to the breast cancer were available. Controls were excluded from the research study if no mammograms were available for analysis. All participants included in the study were of self-declared Chinese, Malay or Indian ethnicity and had information on age at mammography, body mass index (BMI) and/or menopausal status. In total, 10% of cases and 69% of controls were available and eligible for matching.
Matching
For the case–control analysis of mammographic density and breast cancer risk, as raw and processed images were not available for all women, cases and controls in the full dataset were matched for age (within 5 years) and ethnicity (exact) separately for the analyses of STRATUS, which measures processed images, and Volpara, which measures raw images. Age-matching was performed in each ethnic group using a 1:4 case to control ratio nearest neighbour propensity score matching using the matchit package in R. For the STRATUS study, a total of 488 cases and 1796 controls were included in the matched case–control study, of which 82.2% of cases were matched to four controls, 9% to three controls, 3.5% to two controls and 5.3% to only one control. For the Volpara study, a total of 436 cases and 1623 controls were included, of which 81.4% were matched to four controls, 12.4% to three controls, 3.2% to two controls and 3% to only one control. In total, 531 cases and 2297 controls were included for analysis of which data was available for both STRATUS and Volpara in 393 cases and 1122 controls.
Mammographic density (MD) assessments
Mammography was performed using machines from three different manufacturers; Hologic [Models: Lorad Selenia, Selenia Dimensions and Tomo Selenia Dimensions], General Electric (GE) Senographe Essential, and Siemens Mammomat Novation. Area-based MD was determined using STRATUS, a fully automated machine-learning method for assessing MD based on image features assessed using thresholding methods, by the developers of STRATUS at the Karolinska Institute, Sweden [4]. Volumetric MD was computed using Volpara Data Manager version 1.1.109 [5]. Six MD phenotypes were considered in this study: absolute dense area (DA) and volume (DV), percent dense area (PDA, i.e., absolute dense area/total breast area) and volume (PDV, i.e., absolute dense volume/total breast volume), and non-dense area (NDA) and volume (NDV). We also categorised MD according to the computer-generated BI-RADS scores (cBIRADS) generated by STRATUS, and the clinical classification score (Volpara Density Grades (VDG)).
Image laterality
Pearson’s correlation coefficients and previous studies showed that there were strong correlations between CC and MLO measurements [13, 14]. The Wilcoxon rank sum test was performed to compare the distribution of MD in the left and right mammograms in the control group. For the CC view mammograms, percent dense volume was higher in the right breast (Left median 9.1%; Right 9.5%, P = 0.035), whereas for the MLO view, three measures were higher in the left breast [dense volume (Left 57.6 cm3; Right 56.5 cm3, P = 0.006), non-dense volume (Left 591.8 cm3; Right 561.7 cm3, P = 0.011) and total breast volume (Left 653.4 cm3; Right 628.0 cm3, P = 0.006)]. As there was less variation in MD measurements for the CC view, MD measurements from the CC view mammograms of unaffected breasts of cases were used in all analyses, and matched by laterality in the controls.
Statistical analyses
Box-Cox transformation was used to transform MD phenotypes into approximately normal distribution.
Confounder selection
Covariates that were assessed include socio-demographic factors, known lifestyle and reproductive risk factors of breast cancer, mammogram machine and compressed breast thickness. A covariate was considered confounding if: (a) it was significantly associated with MD in controls at P < 0.05, after accounting for other associated variables; (b) it was significantly associated with breast cancer risk at P < 0.05, after accounting for other associated variables; and (c) it had a magnitude of confounding that was greater than 5%.
Age at first full term pregnancy, total number of live births and breast feeding were only evaluated among parous women. Parous women were defined as those who have had at least one full-term pregnancy. The use of hormone replacement therapy (HRT) was only evaluated among postmenopausal women. Postmenopausal women were defined as women who have not had their periods for at least 12 months prior to their enrolment into the study or if they self-reported that they were postmenopausal at enrolment.
Association of mammographic density (MD) phenotypes and breast cancer risk
We assessed the association between mammographic density phenotypes (treated either as continuous or categorical variables) and breast cancer risk using conditional logistic regression, adjusting for selected confounders. When MD was treated as a continuous variable, odds ratios per-adjusted standard deviations (OPERA [15]) was calculated to allow comparison across MD phenotypes. When MD was treated as a categorical variable, MD phenotypes were categorised into four equal quartiles based on the MD distribution in controls, using the first quartile as the reference group. We also categorised MD according to the computer-generated BI-RADS scores, cBIRADS, generated by STRATUS, and Volpara Density Grades (VDG), which is the classification used to report density, measured by Volpara, in the clinic. Weighted kappa, using quadratic weighting, was calculated to assess the concordance between quantiles of STRATUS and Volpara measurements.
The association between MD phenotypes and breast cancer risk by menopausal status were conducted using unconditional regression. Z-tests were conducted to determine whether the odds ratios for mammographic densities and breast cancer risk were different for premenopausal and postmenopausal women.
All statistical analyses were performed with R version 3.6.1.
Results
Characteristics of study participants
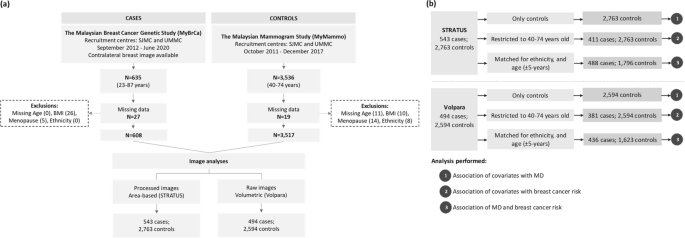
Participant selection and descriptive statistics of cases and controls are presented in Fig. 1 and Table 1. The majority of controls within the STRATUS study (67.7%) were recruited from the private tertiary hospital (SJMC), while approximately half of the controls within the Volpara study were from the government-funded teaching hospital (UMMC). Most of the mammograms were obtained from the Hologic machine.
Flowchart illustrating a the selection of cases and controls for mammographic density (MD) assessment by STRATUS and Volpara, and b participants included in the different analyses performed including the analysis of (1) the association of covariates with MD, (2) the association of covariates with breast cancer risk, and (3) the association of MD and breast cancer risk
Confounders
We identified potential confounders as covariates with P value < 0.05 with both MD phenotypes and breast cancer risk in the multivariable models, and these were breastfeeding for absolute dense area and dense volume, alcohol intake for non-dense volume and breast thickness for all MD phenotypes except dense area (Additional file 1: Table S1). Additionally, although not significant in our study, menopausal status and parity were included as potential confounders as these variables have consistently been reported to be associated with both MD and breast cancer risk in the literature. Of the list of potential confounders, only those resulting in > 5% change in the magnitude of MD association with risk were retained in the model for adjustment. The final list of variables included in the association analyses for adjustment can be found Additional file 1: Table S2.
Association of mammographic density (MD) phenotypes and breast cancer risk
All women
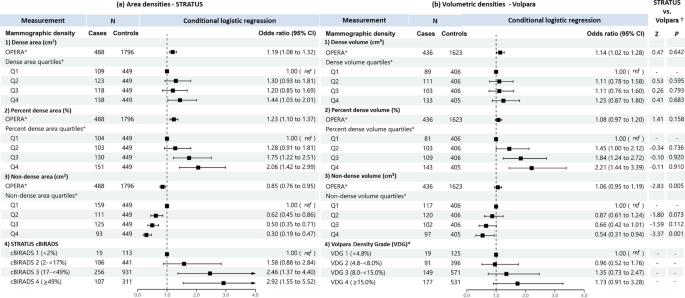
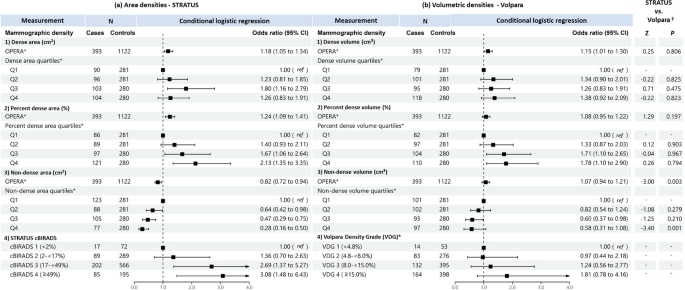
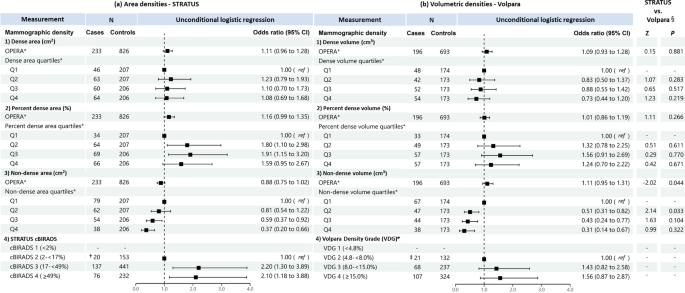
When treated as a continuous variable, both dense area and dense volume were significantly associated with breast cancer risk, the odds per adjusted standard deviation (OPERA) and the corresponding 95% CI were 1.19 (1.08–1.32) and 1.14 (1.02–1.28), respectively (Fig. 2). However, when categorised into quartiles, only the highest quartile of dense area was significantly associated with risk (odds ratio (95% CI) was 1.44 (1.03–1.21)). This association was no longer significant in analyses limited to overlapping samples between the STRATUS and Volpara studies (1.26, 95% CI: 0.83-1.91) (Fig. 3).
Associations of a STRATUS area mammographic densities, b Volpara volumetric mammographic densities, with breast cancer risk in the dataset of 393 cases and 1122 controls included in both STRATUS and Volpara studies. *Adjusted for relevant confounding factors. †Z-tests comparing estimated regression coefficients between the STRATUS and Volpara studies
For percent density, OPERA for percent dense area was significant (1.23, 95% CI 1.10–1.37) while the OPERA for percent dense volume was not significant (1.08, 95% CI 0.97–1.20). However, quartiles analyses of percent density showed significant association for both MD measurement methods, with risk estimates increased consistently across quartiles. The OR of highest versus lowest quartile was 2.06 (95% CI 1.42–2.99) for percent dense area and 2.21 (95% CI 1.44–3.39) for percent dense volume (Fig. 2). There was no significant difference between the ORs of percent dense area and percent dense volume (p-value of Z-test < 0.05). Similar results were observed for analyses limited to overlapping samples between the STRATUS and Volpara studies (Fig. 3).
Non-dense area was significantly associated with a lower breast cancer risk (OPERA 0.85, 95% CI 0.76–0.95). Risk estimates decreased consistently, from OR 0.62 (95% CI: 0.45-0.86) to 0.50 (95% CI: 0.35-0.71) and 0.30 (95% CI: 0.19-0.47), comparing the first quartile of non-dense area with the second, third and fourth quartile, respectively. By contrast, the OPERA estimate for non-dense volume was not significant (1.06, 95% CI: 0.95-1.19), although the pattern of association for quartiles was similar to that observed for non-dense area i.e., OR 0.87 (95% CI: 0.61-1.24), OR 0.66 (95% CI: 0.42-1.01) and OR 0.54 (95% CI: 0.31-0.94) for the second, third and fourth quartiles respectively, the corresponding strengths of association were weaker (Figs. 2 and 3).
Where densities were categorised according to area-based cBIRADS and volume-based VDG, women in cBIRADS 3 and cBIRADS 4 were associated with a 2.5-fold (P = 0.003) and 2.9-fold (P < 0.001) greater odds of disease, respectively (Fig. 2a). By contrast, VDG was not associated with breast cancer risk (Fig. 2b). The same pattern was observed for analyses limited to overlapping samples between the STRATUS and Volpara studies (Fig. 3).
There are no appreciable differences between the results generated using the CC and MLO view measurements (Additional file 1: Table S2).
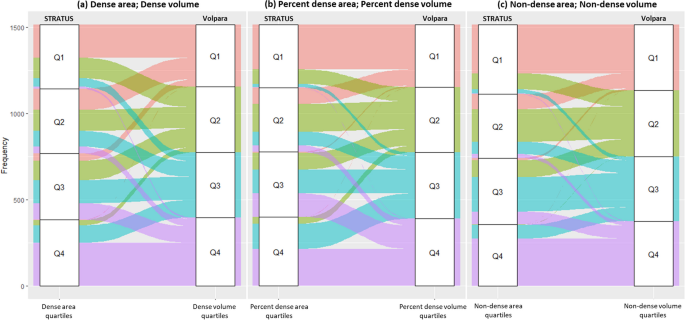
The agreement between the STRATUS and Volpara measurements for classifying women into mammographic density quartiles was fair for absolute density (Weighted Kappa, κw = 0.28) and percent density (0.35), and moderate for non-dense area and volume (0.50). Figure 4 illustrates the magnitude of concordance for the classification of area and volumetric MD quartiles. Although there is some agreement between STRATUS and Volpara, there are instances of discordance where individuals shift to adjacent quartiles or even skip one quartile altogether.
Concordance between the classification of a absolute dense area/volume, b percent dense area/volume and c non-dense area/volume into quartiles using STRATUS and Volpara measurements. Note: Agreement between the STRATUS and Volpara measurements for classifying women into mammographic density quartiles was calculated using Cohen’s weighted kappa. Weighted Kappa, κw values for dense area/volume, percent dense area/volume, and non-dense area/volume were 0.28, 0.35 and 0.50, respectively
Analyses by menopausal status
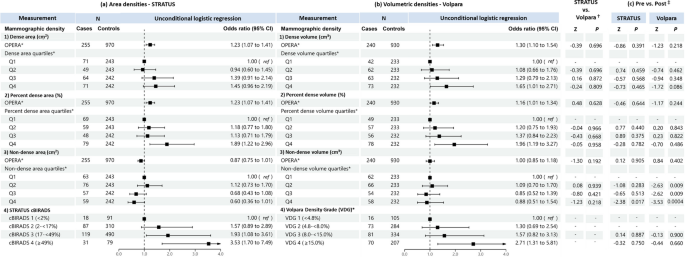
Figures 5 and 6 show the association of MD with breast cancer risk for premenopausal and postmenopausal women, respectively. For dense area and dense volume, both OPERAs and quantile analyses were not significantly associated with breast cancer risk in premenopausal women. By contrast, consistent with the all-women analysis, OPERA for both dense area (OR 1.23, 95% CI: 1.07–1.41) and dense volume (OR 1.30, 95% CI: 1.10–1.54) were significant in postmenopausal women, but the corresponding quartile analyses did not show significant associations for dense area and was only significant for the association of the highest dense volume quartile and risk when compared to the lowest dense volume quartile among postmenopausal women (OR 1.65, 95% CI: 1.01-2.71).
Associations of a STRATUS area mammographic densities and b Volpara volumetric mammographic densities, with breast cancer risk in premenopausal women. *Adjusted for relevant confounding factors. †Reference category is cBIRADS 1 (< 2%) + cBIRADS 2 (2− < 17%). ‡ Reference category is VDG 1 (< 4.8%) + VDG 2 (4.8—< 8.0%). §Z-tests comparing estimated regression coefficients between the STRATUS and Volpara studies
Associations of a STRATUS area mammographic densities, b Volpara volumetric mammographic densities, with breast cancer risk in postmenopausal women and, c comparison of regression coefficients for premenopausal and postmenopausal women. *Adjusted for relevant confounding factors. †Z-tests comparing estimated regression coefficients between the STRATUS and Volpara studies. ‡Z-tests comparing estimated regression coefficients between premenopausal and postmenopausal women
For percent density, OPERAs for percent dense area and percent dense volume were significant in postmenopausal women but not premenopausal women. The OPERAs were 1.23 (95% CI 1.07–1.41) and 1.16 (95% CI 1.01–1.34) for precent dense area and percent dense volume, respectively, in postmenopausal women. The corresponding estimates in premenopausal women were 1.16 (95% CI 0.99–1.35) and 1.01 (95% CI 0.86–1.19). The observed significant association of highest versus lowest quartile in all women analysis was replicated in postmenopausal women (OR 1.89, 95% CI: 1.22-2.96 for percent dense area; OR 1.96, 95% CI: 1.19-3.27 for percent dense volume), but not premenopausal women (OR 1.59, 95% CI: 0.95-2.67 for percent dense area; OR 1.24, 95% CI: 0.70-2.22 for percent dense volume).
For non-dense MD phenotype in both premenopausal and postmenopausal women, OPERAs were not significant in both non-dense area (0.88, 95% CI: 0.75-1.02 and 0.87, 95% CI: 0.75-1.01 for premenopausal and postmenopausal women, respectively) and non-dense volume (1.11, 95% CI: 0.95-1.31 and 1.00, 95% CI: 0.85-1.18, respectively) measurements. However, the quartile analyses for both non-dense area and non-dense volume were significant in premenopausal women, comparing the highest and lowest non-dense area quartiles (OR 0.37, 95% CI: 0.20-0.66) and non-dense volume quartiles (OR 0.31, 95% CI: 0.14-0.67), but not postmenopausal women (OR 0.60, 95% CI: 0.36-1.01 for non-dense area; OR 0.88, 95% CI: 0.51-1.54 for non-dense volume).
Discussion
In this study of women of Asian-ancestry, we found that percent mammographic density is a strong breast cancer risk factor, with similar magnitudes of association for both area and volumetric mammographic density measures. Comparing women in the lowest quartiles, women with percent density in the highest quartiles had approximately two-fold higher odds of breast cancer. The observed association was however significant only in postmenopausal women but not in premenopausal women.
The two-fold risk estimates reported in this study are consistent with those found in a meta-analysis of Japanese, Korean and Singaporean women comprising of one cohort study and five case–control studies, which reported a summary effect size of 2.2 (95% CI 1.5–3.2) [16], as well as with a large meta-analysis of European women using the BI-RADS density four-category classification [3]. The corresponding odds ratio per adjusted standard deviation (OPERA) was similar to a Korean study of 213 cases and 630 controls [17], but lower than those previously reported in women of European ancestry. A study of Australian women reported OPERA of 1.52 (95% CI 1.34–1.73) for percent dense area, compared to 1.23 (95% CI 1.10–1.37) this study, suggesting potential ethnic differences in MD-risk associations [18].
Our findings of lack of MD-risk association in premenopausal women align with similar-sized studies in other Asian populations [19,20,21,22]. For instance, a multicentre Japanese study (530 cases, 1043 controls) found a near three-fold increase in breast cancer odds (OR 2.9, 95% CI 1.1–7.2) among postmenopausal women with extremely dense breast (>75% glandular tissue), while no significant association was observed in premenopausal women [19]. Similarly, another study in Japanese women (146 cases, 659 controls) revealed a four-fold higher odds of breast cancer among postmenopausal women with > 75% percent densities, with no significant association in premenopausal women [21]. However, it is important to note that a recent large prospective Korean study comprising of ~ 65,000 breast cancer cases reported that breast density is associated with breast cancer risk in both premenopausal (OR 2.4, 95% CI 2.2–2.5) and postmenopausal (OR 2.9, 95% CI 2.8–3.0) women, suggesting that larger sample sizes in premenopausal women are required to detect a significant association with breast cancer risk [20].
Our study did not yield conclusive evidence regarding the association of absolute MD measures with breast cancer risk. While the odds ratios for continuous dense area and dense volume were significant at a nominal level (1.19, 95% CI 1.08–1.32 and 1.14, 95% CI 1.02–1.28, respectively), the results from quartile analysis did not support the significant associations. We also observed a stronger inverse association with non-dense area compared to non-dense volume that was significant in our analyses of all women and premenopausal women, but not that of postmenopausal women. This inverse association is consistent with previous studies in women of European ancestry reporting a protective effect of having greater amounts of fat or non-dense tissue in the breast [23].
In summary, our study confirms the significance of MD as a robust breast cancer risk factor in Asian-ancestry women, with percent density showing consistent associations across area and volumetric-based measures. However, the lack of MD-risk association in premenopausal women underscores the need for further investigation in larger datasets. While our findings contribute to the understanding of MD and breast cancer risk, the inconclusive evidence regarding absolute MD measures prompts a critical evaluation of their utility in risk prediction models for this population.
This study had several limitations. First, more than 90% of the cases were recruited from one recruitment centre, making it impossible to match cases and controls based on centre. However, we adjusted our analyses for this factor. Second, some covariates have missingness rates greater than 10%, which may explain some of the unexpected results (e.g. the protective effect observed for HRT among postmenopausal women and alcohol consumption). Third, the healthy controls were women attending an opportunistic screening mammography programme and may be enriched for a family history of breast cancer. This is likely to be the reason family history of breast cancer is not associated with breast cancer risk in this study. Finally, only the mammograms performed at the time of cancer detection (or close to cancer detection) were available for the cases. Given that densities measured from the unaffected contralateral breasts have been shown to be similarly associated with risk of disease [8], densities of the contralateral breasts were used as surrogate measurements.
Conclusions
In conclusion, our study underscores the significance of mammographic density (MD) as a strong predictor of breast cancer risk in women of Asian-ancestry, particularly in postmenopausal individuals. While percent density, for both area- and volume-based measures, consistently demonstrated significant association, absolute MD measures yielded inconclusive results. Future research should aim to elucidate ethnic-specific MD-risk associations and refine risk prediction models to incorporate the most predictive MD measures, thus enabling more targeted preventive strategies for women of Asian ancestry.
Availability of data and materials
Datasets described and analysed in this manuscript are available from the corresponding author on reasonable request.
References
Boyd NF, Guo H, Martin LJ, Sun L, Stone J, Fishell E, et al. Mammographic density and the risk and detection of breast cancer. N Engl J Med. 2007;356(3):227–36.
McCormack VA, dos Santos SI. Breast density and parenchymal patterns as markers of breast cancer risk: a meta-analysis. Cancer Epidemiol Biomark Prev. 2006;15(6):1159–69.
Bodewes FTH, van Asselt AA, Dorrius MD, Greuter MJW, de Bock GH. Mammographic breast density and the risk of breast cancer: a systematic review and meta-analysis. Breast. 2022;66:62–8.
Eriksson M, Li J, Leifland K, Czene K, Hall P. A comprehensive tool for measuring mammographic density changes over time. Breast Cancer Res Treat. 2018;169(2):371–9.
Highnam R, et al., editors. Robust breast composition measurement – Volpara. In: Proceedings of the 10th international workshop on Digital Mammography IWDM’2010; 2010; Berlin, Heidelberg: Springer
Destounis S, Arieno A, Morgan R, Roberts C, Chan A. Qualitative versus quantitative mammographic breast density assessment: Applications for the US and Abroad. Diagnostics (Basel). 2017;7(2):30.
Shepherd JA, Kerlikowske K, Ma L, Duewer F, Fan B, Wang J, et al. Volume of mammographic density and risk of breast cancer. Cancer Epidemiol Biomark Prev. 2011;20(7):1473–82.
Astley SM, Harkness EF, Sergeant JC, Warwick J, Stavrinos P, Warren R, et al. A comparison of five methods of measuring mammographic density: a case-control study. Breast Cancer Res. 2018;20(1):10.
Rajaram N, Mariapun S, Eriksson M, Tapia J, Kwan PY, Ho WK, et al. Differences in mammographic density between Asian and Caucasian populations: a comparative analysis. Breast Cancer Res Treat. 2017;161(2):353–62.
Chen Z, Wu AH, Gauderman WJ, Bernstein L, Ma H, Pike MC, et al. Does mammographic density reflect ethnic differences in breast cancer incidence rates? Am J Epidemiol. 2004;159(2):140–7.
Maskarinec G, Meng L, Ursin G. Ethnic differences in mammographic densities. Int J Epidemiol. 2001;30(5):959–65.
Tan MM, Ho WK, Yoon SY, Mariapun S, Hasan SN, Lee DS, et al. A case-control study of breast cancer risk factors in 7663 women in Malaysia. PLoS ONE. 2018;13(9):e0203469.
van Engeland S, Snoeren PR, Huisman H, Boetes C, Karssemeijer N. Volumetric breast density estimation from full-field digital mammograms. IEEE Trans Med Imaging. 2006;25(3):273–82.
Winkel RR, von Euler-Chelpin M, Nielsen M, Diao P, Nielsen MB, Uldall WY, et al. Inter-observer agreement according to three methods of evaluating mammographic density and parenchymal pattern in a case control study: impact on relative risk of breast cancer. BMC Cancer. 2015;15:274.
Hopper JL. Odds per adjusted standard deviation: comparing strengths of associations for risk factors measured on different scales and across diseases and populations. Am J Epidemiol. 2015;182(10):863–7.
Bae JM, Kim EH. Breast density and risk of breast cancer in asian women: a meta-analysis of observational studies. J Prev Med Public Health. 2016;49(6):367–75.
Kim BK, Choi YH, Nguyen TL, Nam SJ, Lee JE, Hopper JL, et al. Mammographic density and risk of breast cancer in Korean women. Eur J Cancer Prev. 2015;24(5):422–9.
Nguyen TL, Aung YK, Evans CF, Dite GS, Stone J, MacInnis RJ, et al. Mammographic density defined by higher than conventional brightness thresholds better predicts breast cancer risk. Int J Epidemiol. 2017;46(2):652–61.
Nishiyama K, Taira N, Mizoo T, Kochi M, Ikeda H, Iwamoto T, et al. Influence of breast density on breast cancer risk: a case control study in Japanese women. Breast Cancer. 2020;27(2):277–83.
Tran TXM, Moon SG, Kim S, Park B. Association of the interaction between mammographic breast density, body mass index, and menopausal status with breast cancer risk among Korean women. JAMA Netw Open. 2021;4(12):e2139161.
Nagata C, Matsubara T, Fujita H, Nagao Y, Shibuya C, Kashiki Y, et al. Mammographic density and the risk of breast cancer in Japanese women. Br J Cancer. 2005;92(12):2102–6.
Park IH, Ko K, Joo J, Park B, Jung SY, Lee S, et al. High volumetric breast density predicts risk for breast cancer in postmenopausal, but not premenopausal. Korean Women Ann Surg Oncol. 2014;21(13):4124–32.
Pettersson A, Hankinson SE, Willett WC, Lagiou P, Trichopoulos D, Tamimi RM. Nondense mammographic area and risk of breast cancer. Breast Cancer Res. 2011;13(5):R100.
Acknowledgements
We want to thank all the study participants, clinicians, and support staff at Subang Jaya Medical Centre and University Malaya Medical Centre for their generous contributions to the Malaysian Mammography Study (MyMammo) and the Malaysian Breast Cancer Genetic Study (MyBrCa) studies. We thank all the research associates, scientists and staff at Cancer Research Malaysia and University of Malaya who were involved in the MyMammo and MyBrCa studies – this work would not have been possible without their support and contributions.
Funding
The Malaysian Ministry of Science and the Malaysian Ministry of Higher Education High Impact Research Grant (grant number: UM.C/HIR/MOHE/06) was used to fund the Malaysian Breast Cancer Genetic Study (MyBrCa). Funds raised through the Sime Darby LPGA tournament and from the High Impact Research Grant were used to support the Malaysian Mammography Study (MyMammo). Additional funds were received from Yayasan Sime Darby, PETRONAS, Estee Lauder Group of Companies, and other donors of Cancer Research Malaysia. WKH and SM are recipients of the L’Oreal-UNESCO For Women in Science National Fellowship.
Author information
Authors and Affiliations
Contributions
Conceptualization and design: SM, WKH and ST; Data collection: SM, NAMT, CHY, and KR; Data analysis and interpretation: SM, WKH, ME, PH and ST; Manuscript writing: SM, WKH and ST; Reviewed manuscript: SM, WKH, ME, NAMT, CHY, KR, PH and ST.
Corresponding author
Ethics declarations
Ethics approval and consent to participate
The Malaysian Mammography Study (MyMammo) and the Malaysian Breast Cancer Genetics (MyBrCa) studies were approved by the Independent Ethics Committee, Ramsay Sime Darby Health Care (reference numbers 201109.4 and 201208.1) and the Medical Ethics Committee, University Malaya Medical Centre (reference numbers 1030.8 and 842.9). Written informed consent was obtained from all participants.
Consent for publication
Not applicable.
Competing interests
The authors declare no nonfinancial conflicts of interest but the following financial conflict interests: Mikael Eriksson and Per Hall report research grants and a patent on system and method for assessing breast cancer risk using imagery with a license to iCAD, Inc.
Additional information
Publisher's Note
Springer Nature remains neutral with regard to jurisdictional claims in published maps and institutional affiliations.
Supplementary Information
Additional file 1:
Results for confounder selection analyses and sensitivity analysis using MLO view images.
Rights and permissions
Open Access This article is licensed under a Creative Commons Attribution 4.0 International License, which permits use, sharing, adaptation, distribution and reproduction in any medium or format, as long as you give appropriate credit to the original author(s) and the source, provide a link to the Creative Commons licence, and indicate if changes were made. The images or other third party material in this article are included in the article's Creative Commons licence, unless indicated otherwise in a credit line to the material. If material is not included in the article's Creative Commons licence and your intended use is not permitted by statutory regulation or exceeds the permitted use, you will need to obtain permission directly from the copyright holder. To view a copy of this licence, visit http://creativecommons.org/licenses/by/4.0/. The Creative Commons Public Domain Dedication waiver (http://creativecommons.org/publicdomain/zero/1.0/) applies to the data made available in this article, unless otherwise stated in a credit line to the data.
About this article
Cite this article
Mariapun, S., Ho, WK., Eriksson, M. et al. Association of area- and volumetric-mammographic density and breast cancer risk in women of Asian descent: a case control study. Breast Cancer Res 26, 79 (2024). https://doi.org/10.1186/s13058-024-01829-2
Received:
Accepted:
Published:
DOI: https://doi.org/10.1186/s13058-024-01829-2
